Failure Mode and Effects Analysis (FMEA)
Failure Mode and Effects Analysis (FMEA) is a systematic, proactive method for evaluating systems, processes, and risks to identify where and how they might fail and to assess the relative impact of different failures, in order to identify the parts that are most in need of change. The FMEA can be traced back to the US military standard MIL-P-1626 from the 1940s which describes Procedures for Performing a Failure Mode, Effects and Criticality Analysis (FMECA). This method of analysis was prompted by defective ammunition. Following this, in 1963 NASA developed Failure Mode and Effects Analysis (FMEA) for the Apollo mission. The succesful moon landing was in part attributed to the implementation of FEMA. When over a decade later a gas tank burst in a rear-end collision involving a Ford Pinto, the Ford Motor Company introduced FMEA. In the 1980s the German standard DIN 25 448 for failure effect analysis was given the subtitle FMEA. The German Automotive Industry Association (VDA – Verband der Automobilindustrie) further developed the method for the automotive sector and in 1986 published a description in VDA Volume 4. In 1994, the AIAG (Automotive Industry Action Group) added FMEA to the 9000 quality standard for automotive production and its suppliers. This standard then became Norm 16949 of the IATF (International Automotive Task Force), becoming the standard for OEMS worldwide. At the end of May 2019, a harmonized transatlantic FMEA standard was published by AIAG and the VDA’s Quality Management Center (QMC).
To analyze potential errors, consequences and causes, the following W-questions should be answered: Which failures could occur? Which potential failures could occur in the identified sub-processes? (by drawing conclusions from past failures) What consequences would the occurrence of the failure have? What can cause the failures?
For each identified failure/risk, the following three parameters are assessed:
Occurrence (O): How likely is it that the failure will occur?
Severity (S): What effects will the occurrence of the failure/risk have?
Detection (D): How likely is it that the occurrence of the failure/risk will be noticed?
The scale of this score is 1 to 10 for each parameter, so the product, the risk priority number (RPN), can take on a range of values from 1 to 1000.
Steps of FMEA analysis
Step 1: Planning and Preparation
Goal: Define project scope, assemble team, plan project structure, use lessons learned
Tool: Project plan “5T” (intention, time frame, team assignment, task assignment, tool)
Quality Tools
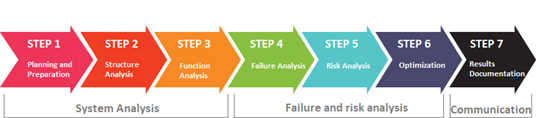
Step 2: Structure Analysis
Goal: Visualization of the design or process structure, analysis of hierarchies, system boundaries, and interaction of components or process steps.
Tools: DFMEA: structure tree, block/boundary diagram, digital model or physical components; PFMEA: structure tree, process flow diagram
Step 3: Functional Analysis
Goal: Analyze functions and failures in the entire system, identification of failure variables, graphical representation of the path from the input to the result.
Tools: DFMEA: function tree/function network: function analysis form and parameter diagram; PFMEA: function tree/function network, process flow diagram.
Step 4: Failure Analysis
Goal: Analysis of failure mode, failure cause and failure effect
Tools: Questioning techniques such as 5-Whys or Ishikawa’s cause-effect diagram (fishbone) DFMEA: Possible failure effects, failure modes and failure causes for each product function; PFMEA: Possible failure effects, failure modes and failure causes for each process function
Step 5: Risk Analysis
Goal: Observation of the actual state and evaluation of the risks with the evaluation numbers SEV (severity), OCC (occurrence), DET (detection), each with values from 1 to 10. Multiplication results in the AP (action priority) with a value from 1 to 1000.
Tools: Evaluation tables. DFMEA & PFMEA: Existing and planned avoidance measures for the failure causes, existing and planned detection measures for the failure causes and failure modes.
Step 6: Optimization
Goal: Define risk reduction measures to produce target state.
Tools: Determination of responsibilities and deadlines for the implementation of measures, after optimization, all 7 steps of the FMEA are run through again if the concept is changed.
Step 7: Results documentation
Goal: Documentation and communication of the FMEA results, creation of a knowledge database
Tools: Contents of the documentation (target/actual comparison, “5 t”, list of participants, scope of consideration, derivation of the functions, summary of the defect type with high risk and description of the prioritization of measures, decided and planned measures incl. status, description of the continuous improvement)
To classify a risk, a risk priority number (RPN) used to be calculated. It is the product of these three ratings which define what is known as a Risk Priority Number (RPN). The PRN number is a numerical assessment of the risk and therefore it highlights key risks and helps to priorities any activities to improve the overall risks. This is done by multiplying Severity, Occurrence and Detection:
RPN = S x O x D
The risk priority number may have a value from 1 to 1,000: 1 ≤ RPN ≤ 1,000. The higher the RPN, the more serious the error/risk and the greater the need for action.
Once you have reviewed the potential reasons why a process, product or service my fail and the impact to the business, you are then in a position to begin to reduce and improve the overall risk management.
So the first step is to take the highest PRN score and begin as a team to identify potential ways to reduce the risk if the risk is deemed too high. You can:
Highlight actions to reduce the risk
Identify the person who will lead the activity and when they will deliver it
Record the actions that are taken
And then, you can update the Severity, Occurrence and Detection scores to calculate a new RPN.
This process can continue until you have levels of risk that you are happy with.
RPN - RISK OF FAILURE
100 ≤ RPN ≤ 1,000 high – acute need for action must be formulated and implemented
50 ≤ RPN ≤ 100 medium – need for action should be formulated and implemented
2 ≤ RPN ≤ 50 acceptable – no urgent need for urgent action, improvements only
RPN = 1 none no need for action
Measurement System Analysis (MSA)
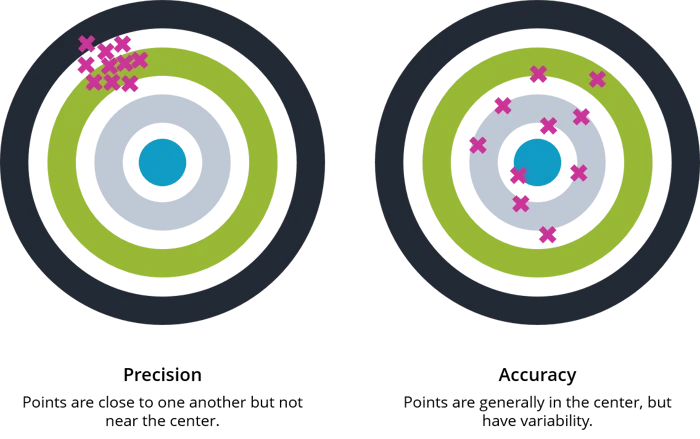
MSA is defined as an experimental and mathematical method of determining the amount of variation that exists within a measurement process. Variation in the measurement process can directly contribute to our overall process variability. MSA is used to certify the measurement system for use by evaluating the system’s accuracy, precision and stability.
A measurement system has been described as a system of related measures that enables the quantification of particular characteristics. It can also include a collection of gages, fixtures, software and personnel required to validate a particular unit of measure or make an assessment of the feature or characteristic being measured. The sources of variation in a measurement process can include the following:
Process – test method, specification
Personnel – the operators, their skill level, training, etc.
Tools / Equipment – gages, fixtures, test equipment used and their associated calibration systems
Items to be measured – the part or material samples measured, the sampling plan, etc.
Environmental factors – temperature, humidity, etc.
All of these possible sources of variation should be considered during Measurement System Analysis. Evaluation of a measurement system should include the use of specific quality tools to identify the most likely source of variation. Most MSA activities examine two primary sources of variation, the parts and the measurement of those parts. The sum of these two values represents the total variation in a measurement system.
Why Perform Measurement System Analysis (MSA)
An effective MSA process can help assure that the data being collected is accurate and the system of collecting the data is appropriate to the process. Good reliable data can prevent wasted time, labor and scrap in a manufacturing process. A major manufacturing company began receiving calls from several of their customers reporting non-compliant materials received at their facilities sites. The parts were not properly snapping together to form an even surface or would not lock in place. The process was audited and found that the parts were being produced out of spec. The operator was following the inspection plan and using the assigned gages for the inspection. The problem was that the gage did not have adequate resolution to detect the non-conforming parts. An ineffective measurement system can allow bad parts to be accepted and good parts to be rejected, resulting in dissatisfied customers and excessive scrap. MSA could have prevented the problem and assured that accurate useful data was being collected.
How to Perform Measurement System Analysis (MSA)
MSA is a collection of experiments and analysis performed to evaluate a measurement system’s capability, performance and amount of uncertainty regarding the values measured. We should review the measurement data being collected, the methods and tools used to collect and record the data. Our goal is to quantify the effectiveness of the measurement system, analyze the variation in the data and determine its likely source. We need to evaluate the quality of the data being collected in regards to location and width variation. Data collected should be evaluated for bias, stability and linearity.
During an MSA activity, the amount of measurement uncertainty must be evaluated for each type of gage or measurement tool defined within the process Control Plans. Each tool should have the correct level of discrimination and resolution to obtain useful data. The process, the tools being used (gages, fixtures, instruments, etc.) and the operators are evaluated for proper definition, accuracy, precision, repeatability and reproducibility.
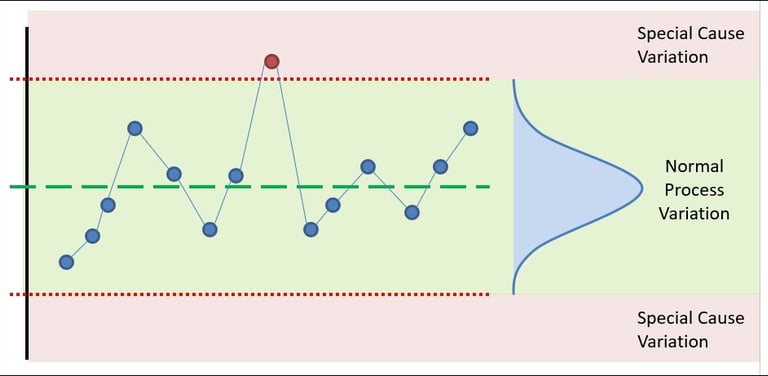
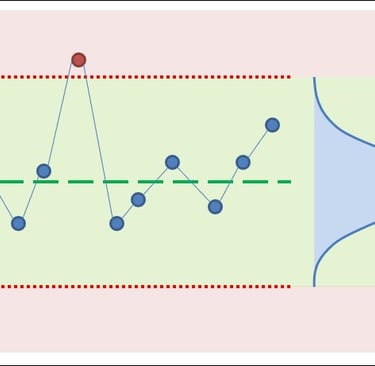
Statistical Process Control (SPC)
SPC is method of measuring and controlling quality by monitoring the manufacturing process. Quality data is collected in the form of product or process measurements or readings from various machines or instrumentation. The data is collected and used to evaluate, monitor and control a process. SPC is an effective method to drive continuous improvement. By monitoring and controlling a process, we can assure that it operates at its fullest potential. One of the most comprehensive and valuable resources of information regarding SPC is the manual published by the Automotive Industry Action Group (AIAG).
Why Use Statistical Process Control (SPC)
Manufacturing companies today are facing ever increasing competition. At the same time raw material costs continue to increase. These are factors that companies, for the most part, cannot control. Therefore companies must concentrate on what they can control: their processes. Companies must strive for continuous improvement in quality, efficiency and cost reduction. Many companies still rely only on inspection after production to detect quality issues. The SPC process is implemented to move a company from detection based to prevention based quality controls. By monitoring the performance of a process in real time the operator can detect trends or changes in the process before they result in non-conforming product and scrap.
COntact
info@theprojectsphere.com
© 2025. All rights reserved.